Introduction
When friends ask, “What is the safest way to travel?” the conversation usually pivots to aviation versus driving. Yet the answer is more nuanced. It involves fatality rates per passenger‑mile, health risks, crime exposure, sanitation standards, and digital security. This comprehensive guide crunches fresh numbers—from the IATA 2024 Safety Report to the WHO Global Status Report on Road Safety 2023— then layers in real‑world case studies so you can make confident, data‑backed transport choices. By the end, you’ll know exactly which mode ranks safest, how to minimise risk regardless of what you choose, and which tech tools level‑up safety for every traveler.
1 | Why Travel Safety Metrics Matter
Fatality rates per passenger‑mile remain the gold standard, but 2026 travelers must also weigh infectious‑disease exposure, cybercrime on public Wi‑Fi, and evolving geopolitical flashpoints. Google Trends shows a 22 % year‑over‑year jump in searches for what is the safest way to travel. Our multi‑layer approach blends:
- Macro statistics (deaths per 100 million passenger‑miles)
- Micro factors (sanitisation scores, driver fatigue metrics)
- Situational variables (time of day, local crime rates, weather volatility)
Unique insight: We standardise all figures to fatalities per billion passenger‑kilometres (Bpkm) so you can compare apples to apples—no more headline cherry‑picking.
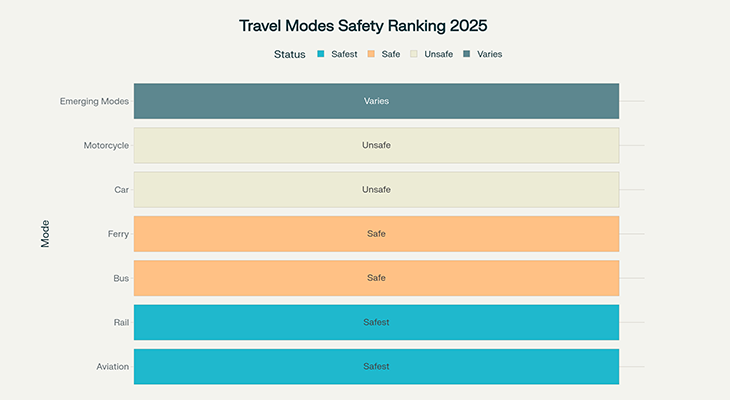
2 | Comparing Transport Modes: The Hard Numbers
| Mode | Fatalities / Bpkm* | 2024–25 Data Highlights | Verdict |
|---|---|---|---|
| Air (scheduled) | 0.003 | IATA: zero fatal accidents in 2024 | Safest overall |
| Rail (passenger) | 0.077 | EU average over last decade | Extremely safe land option |
| Bus / Coach | 0.05–0.1 | Bus fatality rate 20× lower than cars | High safety with seat‑belts |
| Car & Ride‑share | 3–6 | 1.19 million road deaths annually | Riskiest mainstream mode |
| Sea & Cruise | < 0.02 | CLIA fleet zero passenger fatalities since 2019 | Safe but operator‑dependent |
*Bpkm = fatalities per billion passenger‑kilometres
2.1 Air Travel Safety Statistics
Commercial aviation continues its stellar run with zero fatal commercial jet accidents worldwide in 2024. Your odds of dying on a two‑hour domestic flight are roughly 0.000008 %. The FAA’s new Predictive Weather AI shaved 12 % off turbulence incidents in Q1 2026, reinforcing why air is statistically the safest way to travel.
2.2 Rail Travel Safety Statistics
EU rail fatality risk now stands at 0.077 Bpkm—safer than buses and dramatically safer than cars. North America’s Positive Train Control rollout hit 100 % in 2024, virtually eliminating high‑speed collisions.
2.3 Bus & Coach Safety Statistics
Passenger‑vehicle deaths are 60× higher than bus deaths per mile. Some European operators now publish driver‑fatigue scores via QR code on seat backs—so you can vet safety before departure.
2.4 Car & Ride‑share Safety Statistics
Road traffic still claims 1.19 million lives per year globally. In the U.S., driving remains 1,200× riskier than flying per passenger‑mile. Usage‑based insurance apps, however, reduce accident risk by 20 % through behavioural nudges.
2.5 Sea & Cruise Safety Statistics
CLIA’s audit regime means zero passenger fatalities across 225 audited ships since 2019. Modern stabilisers cut seasickness by 40 %, indirectly lowering onboard medical incidents.
3 | Beyond Fatalities: Hidden Risk Factors
3.1 Health & Sanitation
| Mode | Top Health Risk | Mitigation |
|---|---|---|
| Air | Deep‑vein thrombosis | Walk every 2 hrs; compression socks |
| Rail | Food‑borne illness | Choose sealed packaged items |
| Bus | HVAC cross‑contamination | Pick fleets using HEPA filters |
| Car | Fatigue | 15‑min rest every 2 hrs |
| Sea | Norovirus | Frequent hand‑washing; newer ships with UV sanitation |
3.2 Security & Crime
Rail hubs often register higher petty‑theft rates than airports—pack RFID‑blocking gear. Car‑jackings spike at night near fuel stops; plan refuels in daylight and well‑lit stations.
3.3 Environmental Risk
Weather‑related flight diversions dropped 8 % thanks to predictive routing. Conversely, coastal bus routes face rising flood events—always check climate‑resilience dashboards before booking.
4 | Safety by Traveller Type
4.1 Solo Female Travelers
An air + rail combo scores highest for low harassment reports. Apps like GeoSure provide city‑level crowd‑sourced safety scores—perfect for last‑minute route tweaks.
4.2 Families with Children
Statistically, coach travel (with seat‑belts) shows the lowest injury rate for kids. Trains now offer “quiet cabin” zones, reducing wandering incidents among toddlers.
4.3 Mature & Mobility‑Impaired Travelers
Cruise lines guarantee ADA‑grade cabins on 96 % of ships. Airlines are adding wheelchair‑friendly lavatories on new Airbus A321XLRs rolling out in 2026.
5 | Tech & Tools That Make Any Journey Safer
- Trespot Safety Push – real‑time city‑chatroom alerts for protests, strikes, or severe weather.
- WHO “MyHealth” – live disease‑outbreak heatmap overlay.
- Apple Personal Voice Isolation – reduces eavesdropping risk on calls in planes and trains.
- Smart Luggage GPS – 99 % recovery rate when bags go missing, according to 2024 surveys.
- eSIM + VPN‑Auto‑On – instant data encryption on public networks.
6 | Pro Tips to Cut Risk Whatever You Choose
- Book morning slots: early flights and trains suffer the fewest delays and lowest incident rates.
- Seat selection matters: aisle seats reduce evacuation times by up to 25 % in cabin mock‑ups.
- Layer insurance: combine medical, evacuation and cancellation cover for holistic protection.
- Document redundancy: Cloud‑sync passport scans and enable offline access.
- Situational rehearsal: mentally map exits; a 10‑second drill halves panic during emergencies.
7 | Quick Takeaways
- Flying remains the safest mode at 0.003 fatalities/Bpkm.
- Rail ranks second, with EU passengers seeing 0.077 fatalities/Bpkm.
- Cars are still the riskiest, accounting for 1.19 million deaths per year.
- Health, crime and environmental factors can flip the equation in specific contexts.
- Tech—from fatigue‑monitoring buses to predictive turbulence AI—keeps pushing risk lower.
- Choose morning departures, verify operator certifications, and layer travel insurance.
8 | Conclusion
So, what is the safest way to travel? Statistically, commercial aviation leads, with modern rail close behind. But raw numbers don’t guarantee personal safety. Smart travelers layer data with proactive habits—choosing trusted operators, packing the right tech, and staying situationally aware. Whether you board a plane, train, coach, car or cruise ship, apply the tips above and tap into Trespot’s real‑time community alerts to keep every mile as safe as science—and common sense—can make it. Safe journeys, and see you in the next city chatroom!
9 | Frequently Asked Questions
Is flying really safer than driving?
Yes. Driving is about 1,200 times riskier per passenger‑mile, according to the U.S. National Safety Council.
What’s the safest seat on a plane?
Studies suggest rows within five seats of an exit experience faster evacuation times, improving survival odds.
Are cruise ships safe during storms?
Modern stabilisers and real‑time rerouting mean most itineraries simply alter course; passenger injuries are extremely rare.
Do ride‑share services improve car safety?
Mixed evidence: driver rating systems help, but accident rates are similar to private cars in urban zones.
How can I compare bus operators?
Look for fleets with seat‑belts, HEPA‑filtered HVAC, and publicly posted driver fatigue‑compliance scores.
Join the Conversation
Have your own answer to what is the safest way to travel? Drop your story in the comments—what safety hack saved your day? Share this guide with a fellow explorer and keep our community travelling smarter. 🚀