Choosing how to get from point A to point B is no longer just about speed or price modern travelers, digital nomads, and community-centric explorers want evidence on what is the safest mode of travel, not anxiety-driven headlines.
Ask a roomful of frequent travelers “what is the safest mode of travel” and most will answer “flying,” some will argue for “trains,” and nearly everyone underrates how routine road crashes overshadow rare aviation incidents; this perception gap is widened by the dramatic media visibility of airline events compared with the quiet repetition of daily roadway fatalities.
In 2026, transparent multi‑modal datasets accident rates per million flight sectors, passenger-mile fatality ratios for buses, trains, ferries, passenger vehicles, and motorcycles allow us to replace fear with informed planning, plus incorporate sustainability and networking dimensions for smarter travel itineraries.
This guide breaks down definitions (per trip vs per mile vs per hour), ranks modes, explores why aviation leads, clarifies rail and bus advantages, examines maritime variability, highlights high motorcycle risk, previews emerging eVTOL/autonomous paradigms, and offers a traveler decision framework backed by data literacy and community intelligence.
1. Framing the Question: What “Safest” Really Means
Absolute vs Relative Risk (Per Mile / Per Trip / Per Hour)
“Safest” shifts depending on whether we measure fatalities per passenger mile, per trip (journey event), or per hour of exposure; aviation excels per mile because long distances dilute incident probability, while per-trip comparisons may narrow gaps between short regional flights and surface modes.
Injury vs Fatality vs Incident Rate
Aviation may record very low fatality risk yet still track non-fatal incidents, whereas bus or rail systems log more minor injuries (slips, platform events) without compromising their comparatively low fatal risk, underscoring why aggregated “accidents” must be parsed by severity type.
Why Definitions Matter for Travelers
Selecting a mode for a 400 km corridor trip demands context: per-mile fatality ratios favor aviation and rail sharply over private car travel, but door-to-door risk may rise if additional transfers or late-night rideshares inflate road exposure segments at each end.
2. Global Ranking: Safest Modes of Travel by Statistics
Commercial Aviation
Commercial airlines consistently post the lowest passenger fatality rates per passenger mile, with recent data showing orders of magnitude difference compared to road vehicles, and controlled flight sectors tracked through rigorous safety management systems.
Scheduled Bus & Coach
Bus travel exhibits a death rate dozens of times lower than passenger cars per passenger mile; professional drivers, regulated duty cycles, and high-occupancy risk dilution drive this outcome across urban and intercity networks.
Rail (Intercity + Metro)
Rail’s structured right-of-way, signaling redundancy, and decreasing accident/derailment indices expand its safety margin, with recent improvements showing multi-year declines in accident and injury rates.
Ferries & Large Passenger Ships
Overall ferry passenger-kilometer safety can be strong in regulated regions, yet concentrated catastrophic events in certain corridors and a spike in 2023–early 2024 fatalities highlight geographic variability and enforcement gaps.
Automobiles (Private Cars & Ride Shares)
Passenger vehicles dominate absolute fatalities due to ubiquitous exposure and higher per-mile death rates versus mass transit modes, magnifying cumulative risk even where technology aids are improving crash survivability.
Motorcycles & Micro-Mobility (Scooters, Bikes)
Motorcycle fatality rates per vehicle mile drastically exceed those for cars, and rising trends in recent data spotlight vulnerability from minimal structural protection and kinetic energy transfer in collisions.
3. Commercial Aviation: Why Flying Leads the Safety Charts
Redundancy & Engineering
Aviation safety is engineered through multi-layer redundancy duplicate flight control systems, independent power sources, stringent certification cycles and global investigative feedback loops which iteratively harden design standards.
Training & Human Factors
Standardized crew resource management (CRM) and continuous simulator training mitigate human error, while data-sharing alliances and safety management systems create a learning ecosystem unmatched by fragmented private road driving.
Data: Accident & Fatality Rates Trend
Recent aviation safety summaries report low accident rates per million flight sectors and year-over-year declines in subcategories like IOSA-registered carrier events, sustaining aviation’s leading relative safety position.
Addressing Recent Headlines vs Long-Term Trend
High-profile accident news can skew perception even while aggregate fatality risk remains extremely low, with investigation debates (e.g., cockpit video recorders) focusing on incremental improvements rather than systemic safety deficits.
4. Rail Travel Safety: Strengths and Edge Cases
Rail vs Road Comparative Risk
Passenger rail fatality rates remain substantially lower than car travel, with analyses noting many reported “rail fatalities” involve trespassing or level crossings rather than on-board passenger casualties, preserving rail’s relative safety advantage.
Level Crossings & Trespass Incidents
Risk concentration at crossings and unauthorized track access drives a significant share of incident counts, so engineering controls (grade separation) and enforcement represent the highest marginal safety returns in developed networks.
High-Speed Rail Considerations
High-speed rail safety frameworks leverage dedicated corridors and advanced signaling; continuous infrastructure monitoring and fewer interference points reduce crash likelihood relative to mixed-traffic roadway environments.
5. Bus & Coach Travel: System Design and Urban Safety
Professional Drivers & Fleet Regulation
Professional licensing, controlled duty hours, fleet maintenance scheduling, and high passenger occupancy dramatically dilute per-passenger risk, explaining bus fatality rates that are tens-of-fold lower than cars.
Urban vs Long-Distance Bus Risk Profiles
Urban transit buses face more conflict points (intersections, pedestrian interactions), while long-distance coaches benefit from highway consistency; yet both preserve low per passenger-mile fatal outcomes compared to private vehicles even amid evolving security and operator assault concerns.
6. Cars and Motorcycles: Why Personal Road Travel Dominates Risk
Exposure & Frequency
Passenger vehicle usage frequency and total mileage amplify cumulative risk, leading to disproportionate national fatality burdens versus low-frequency modes like commercial flights or intercity rail.
Human Error, Speed, Impairment
Speed variance, distraction, impairment, and decentralized training standards consolidate road travel’s higher fatality rate, while motorcycles compound vulnerability through minimal crash energy absorption structures.
Emerging Vehicle Safety Tech (ADAS, Autonomy)
Advanced driver-assistance systems promise incremental risk reduction, yet uneven adoption and user miscalibration mean aggregate national fatality reductions lag behind theoretical safety potential.
7. Maritime & Ferry Travel: Low Frequency, High Consequence Scenarios
Regulatory Oversight (SOLAS etc.)
International ferry safety frameworks and ship construction standards contribute to generally low incident rates in heavily regulated corridors, yet enforcement gaps in certain regions drive uneven global performance.
Weather & Route Factors
Meteorological volatility, overloading, and route crowding can escalate casualty proportions when failures occur, making local operator due diligence and passenger awareness vital components of practical ferry safety.
8. New & Emerging Modes: eVTOL, Hyperloop Concepts, Autonomous Vehicles
Technology Readiness & Safety Certification Path
Emerging modes pursue aviation-style certification models emphasizing redundancy and fail-operational architectures, aiming to inherit aviation’s statistical safety culture before mass deployment.
Anticipated Risk Mitigation Systems
Predictive analytics, real-time health monitoring, and connected vehicle ecosystems are expected to drive proactive maintenance and collision avoidance, paralleling current advances in aviation predictive maintenance scaling.
9. Perception vs Reality: Why We Fear Flying More Than Driving
Availability Heuristic & Media Amplification
Rare but dramatic aviation crashes occupy disproportionate cognitive space versus everyday road fatalities, reinforcing fear patterns even as per-mile air fatality metrics remain extremely lo
Social Media Viral Incident Dynamics
Algorithmic amplification of cockpit or in-flight incident footage elevates salience, while diffuse reporting of thousands of minor road crashes disperses emotional impact and undermines risk calibration.
Cognitive Bias Traveler Checklist
Structured reflection on probability vs vividness, sample size awareness, and aggregate exposure helps travelers realign subjective anxiety with statistical baselines across modes.
10. Choosing the Safest Mode for Different Trip Types
Short Intercity (Under 500 km)
For sub-500 km routes, high-frequency rail or coach often minimizes door-to-door risk by limiting ancillary car segments and leveraging lower per passenger-mile injury rates; if rail infrastructure is modern and punctual, it can pair safety with reduced emissions.
Medium-Haul (500–1,500 km)
Medium-haul journeys balance time savings of aviation against transfer road segments; flying preserves low per-mile fatality metrics, while night or early hour road legs should be optimized for alertness and professional transport providers.
Long-Haul & International
Long-haul aviation concentrates distance into a single low-probability event, further diluting per-mile risk compared to multi-day driving where cumulative exposure compounds probability of incident.
Multi-Modal Optimization (Combining Train + Flight)
Strategically replacing short feeder flights with rail segments can preserve aviation safety margins, cut surface congestion exposure, and integrate sustainable decision layers without materially raising risk.
11. Safety Plus Sustainability: Balancing Risk and Carbon Footprint
Emissions vs Safety Trade-offs
Rail and bus often deliver combined safety and lower emissions advantages on short-to-medium corridors, while aviation’s unmatched speed on long-haul sectors offsets higher per trip emissions where no practical low-carbon alternative exists.
When Rail or Bus Wins Overall
In regions with robust electrified rail or high-quality coach networks, choosing these modes reduces both per-passenger emissions and reliance on higher-risk private car segments, amplifying holistic trip safety.
12. Practical Traveler Safety Strategies (Regardless of Mode)
Pre-Trip Risk Research & Advisory Sources
Leveraging official safety data portals and regulatory updates empowers better routing choices and awareness of localized anomalies like unauthorized or non-compliant bus operations requiring traveler vigilance.
Seat Selection & Cabin Behavior (Plane, Train, Bus)
Fastening restraints consistently, minimizing loose carry-on mass, and locating nearest exits improve survivability envelopes in low-probability events across pressurized cabins or coaches.
Personal Health & Fatigue Management
Managing circadian disruption (hydration, movement, rest) reduces secondary risk factors like impaired situational awareness during transfers, contributing indirectly to overall trip safety.
13. Data Literacy: How to Read and Compare Transport Safety Stats
Passenger Mile vs Passenger Kilometer vs Flight Cycle
Passenger-mile metrics advantage high-distance modes, while per-cycle or per-trip statistics highlight exposure at takeoff, landing, or terminal interface points, requiring aligned denominators before cross-mode assertions.
Understanding Confidence Intervals / Rare Event Statistics
Low absolute counts (e.g., single-digit annual fatal aviation events) produce statistical volatility, so multi-year rolling averages better reflect authentic risk baselines than isolated yearly spikes.
Avoiding Misleading Aggregations
Aggregating trespass and crossing incidents under “rail fatalities” without disaggregation can misrepresent passenger-involved casualty risk, underscoring importance of contextual segmentation.
14. Future Trends: AI, Predictive Maintenance, and Real-Time Monitoring
Aviation (NextGen ATC, Predictive Analytics)
Predictive maintenance platforms anticipate component wear, potentially lowering unscheduled failure probabilities while reducing downtime and supporting continuous safety performance improvements.
Rail (Condition-Based Maintenance)
Declining derailment and mainline accident rates reflect adoption of sensor-driven infrastructure monitoring and data-informed scheduling optimizing track and rolling stock reliability.
Road (Connected Vehicle Ecosystems)
Widespread integration of connected safety alerts promises hazard anticipation, but uneven deployment and driver adaptation periods delay immediate large-scale fatality reductions.
15. Traveler Community & Networking Impact on Safety
Peer Tips & Local Intel (Apps & Platforms)
Community platforms enable real-time sharing of localized hazards (unauthorized transport operators, weather disruptions), democratizing early-warning safety intelligence.
Reporting Hazards & Collective Vigilance
Crowdsourced near-miss reporting parallels formal safety management systems by surfacing precursor signals faster than official periodic bulletins, reinforcing layered defenses.
Building Confidence Through Shared Data
Transparent sharing of modality risk ratios recalibrates traveler anxiety, encouraging shifts from higher-risk private car segments toward safer mass transit options where feasible.
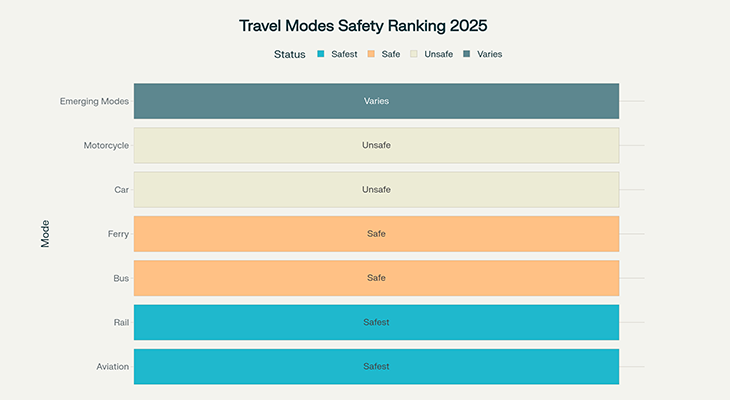
16. Quick Takeaways
- Commercial aviation remains the lowest fatality risk per passenger mile among major modes.
- Bus and rail deliver dramatically safer ratios than private cars, amplified by professional operation and controlled corridors.
- Road travel (especially motorcycles) dominates absolute fatalities due to high exposure and higher per-mile rates.
- Ferry safety is regionally uneven; regulated corridors outperform areas with enforcement gaps.
- Perception gaps arise from media amplification of rare air events vs normalized road casualties.
- Predictive maintenance and AI enhance proactive safety across aviation and rail.
- Community intelligence helps travelers avoid localized emerging safety issues.
17. FAQs
1. What is the safest mode of travel per passenger mile in 2026?
Commercial aviation posts the lowest fatality rate per passenger mile, far below passenger vehicles and even below already low bus and rail metrics.
2. Is flying safer than driving for short trips?
Yes per mile, but for very short corridors total door-to-door differences narrow; still, cars retain a higher per-mile fatality rate even on brief journeys.
3. Are trains safer than cars for intercity travel?
Passenger rail fatality risk is substantially lower than car travel, with many “rail fatalities” involving trespass rather than passengers on board.
4. Why are motorcycle risks so high?
Motorcycles lack structural protection and exhibit high fatality rates per vehicle mile, with recent increases tied to exposure shifts and vulnerability.
5. How will predictive maintenance improve travel safety?
Predictive analytics identify component degradation early, reducing mechanical failure probability and supporting continuous safety gains across aviation and rail.
18. Conclusion
Answering “what is the safest mode of travel” requires disciplined metric selection: per passenger mile and global fatality risk, aviation sits at the apex, trailed by rail and bus, while private road modes especially motorcycles carry far higher exposure-adjusted danger.
Informed travelers can strengthen personal safety by substituting rail or coach for short corridors, minimizing late-night driving, embracing vetted operators, and using community intelligence to flag anomalies, while future AI-driven predictive maintenance and connected ecosystems promise further systemic risk compression.
Leverage this data to plan itineraries that are not only safe but also sustainable and socially connected then share insights with your travel network to collectively elevate global trip safety norms.